Reporting & alerting
DevOps teams want to, and need to, have constant and direct insight into the status of the IT system. And if something (either in product or process) deviates from the expectations, they must be alerted as soon as possible. Therefore, DevOps teams will use state-of-the art tools for reporting and alerting, where on-line real-time dashboards are today perceived as need-to-haves.
Usually there are multiple audiences for the information that the team generates based on their quality engineering activities. This information is supplied to the stakeholders to enable them to establish their level of confidence that the pursued business value can be achieved, and to determine if the IT system is ready to be released and deployed.
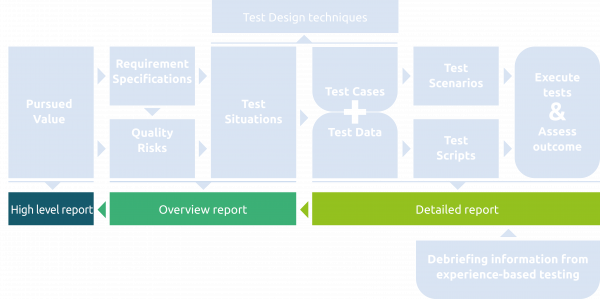
Below figure shows three levels of reporting applicable to most organizations. The information must be provided in the right form for the involved stakeholder, ranging from very detailed for team members (shown on the right) to very aggregated high-level reports for business managers (shown on the left of the figure).
Supplying information is a very important result of QA & testing. But to truly add value, this should be complemented by alerting the right people if action is needed. A basic level of alerting is found in the anomaly management system where the registration of an anomaly triggers various actions concerning investigation and fixing of such an anomaly. On higher levels, alerts may trigger stakeholders as soon as there is a likelihood that certain goals will not be reached. Such alerts should come at the earliest possible moment, that is, as soon as there is a clear trend towards an undesired outcome. It is advisable not to wait with the alert until the target is actually missed; a timely alert will help perform corrective actions to bring the situation back in control. The most sophisticated level of alerting is reached when prescriptive analytics are used that give an alert when the quality is forecasted to go below a certain threshold, so that the people involved can fix a problem even before any user has observed a failure.
What information do the stakeholders need?
In general, stakeholders need information about the status of the product (= the test object) and the status of the test process. The definition of testing states that the stakeholders need information about the quality and the related risks, this refers to the product-related information. They also need information about time and budget, that is the process-related information. The next figure shows these four aspects of the reporting.
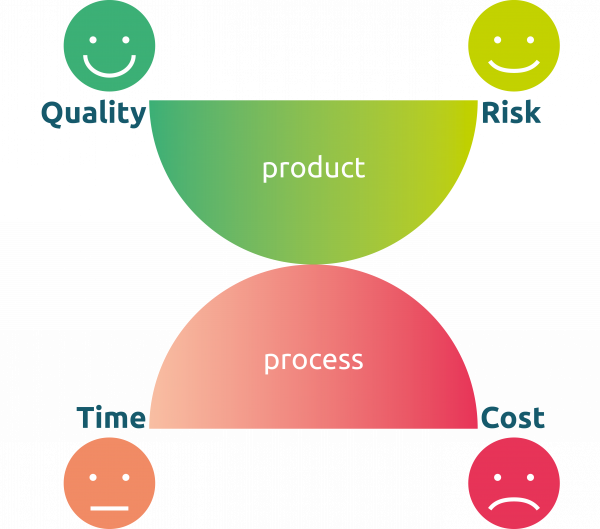
The coloring in the figure is just an example. Any of the four aspects (quality, risk, time and cost) may have a green, amber or red smiley depending on the current situation. Quality and Risk relate to the product-side of reporting, Time and Cost relate to the process.
Information based on indicators
The VOICE model describes that QA & testing measures indicators that are related to the objectives of the organization.
There will be a variety of indicators. The following sections will provide you with an overview of common indicators. This list is intended to trigger you to define your team's specific indicators; it is by no means complete and must be attuned to your specific situation.
Detailed reporting
The detailed reporting is useful for the members of the team and their direct peers and contacts. The core of the detailed reporting is the status and results of test execution. For a test case, the status is "pass" (the expected and actual outcomes match) or "fail" (the expected and actual outcomes are different) or "not run" (the test case could not be executed, for example because a previous test case failed and therefore blocks further execution).
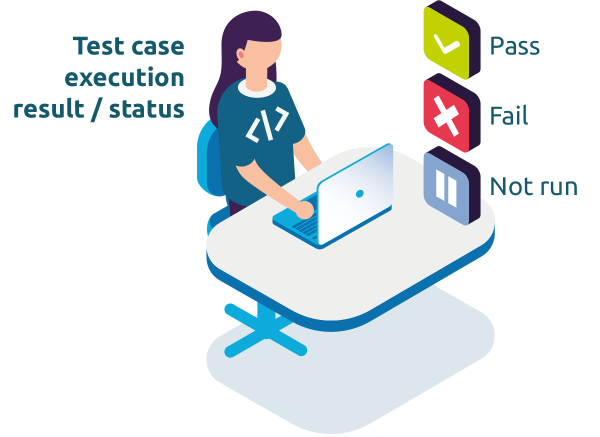
The detailed reporting may even be more granular, stating the result per individual test step within a test case. The results must also be aggregated, from a physical test case to a logical test case, and then to the related test situation(s). Using the links in configuration management identifying that a specific test case has passed or failed also provides information about the requirements status.
Overview reporting
The stakeholders that are outside the team but still closely involved, do not want this detailed level of information. They will often be satisfied with the type of graphs shown in the next sections, supplemented with some commentary text and/or numbers.
Ideally, the information is presented on a real-time dashboard that constantly updates with the latest information. Using sophisticated tooling, the dashboard can even be adjusted to the needs of the specific (group of) stakeholder(s).
We distinguish six groups of information: quality, risk, time, cost, anomalies and confidence. Each is explained in the following sections.
Information about quality
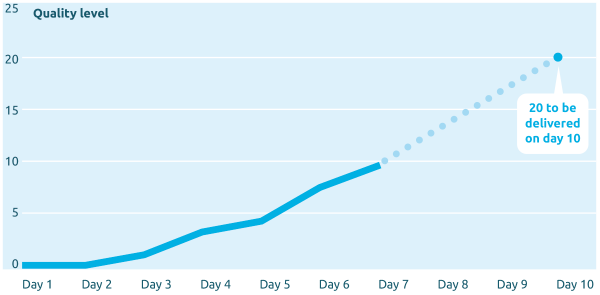
The quality level can be measured in several ways:
-
Requirements coverage – which requirements have been demonstrated to be implemented
-
Quality characteristics – which quality characteristics have been demonstrated to be implemented.
-
Business process coverage – which (parts of) business process(es) have been demonstrated to be implemented
Information about risks
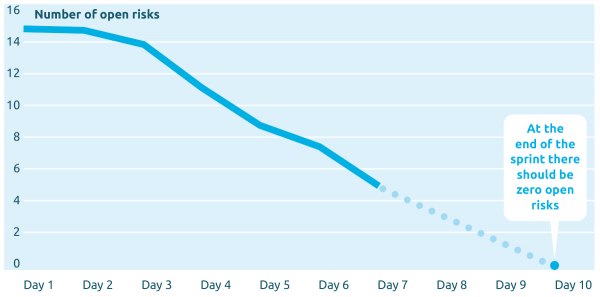
Based on the quality risk analysis (also known as product risk analysis) there is an overview of the risks that need to be covered by testing. Every time a risk is covered this is reflected by a decrease in the number of open risks in the risk-burndown-chart.
Information about time
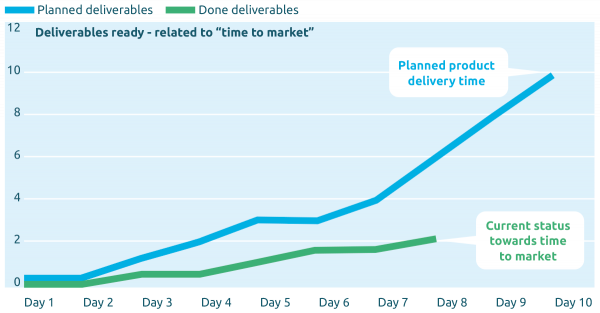
There are several different aspects of time that may be relevant to the stakeholders. The most important measurement usually is: "will the product be available at the moment the stakeholders need it?" We simply call this: "time to market". Whether we can reach the time to market depends on the number of deliverables that need to be ready at that time.
In high-performance IT delivery, the time to market may relate to the deliverables of one sprint as well as to the deliverables of a release that is created in multiple sprints, maybe even by multiple teams.
Measuring a deliverable being available to deliver is in the definition of done. When a deliverable complies with the definition of done, it will be counted as available, when it does not comply, it is not counted. So, for an individual deliverable it is a yes/no measurement. For all deliverables together it is a percentage of the total number of deliverables compared to the "done" deliverables. A common example of a deliverable is a user story. People at a higher level in an organization may want to have this information aggregated to the business-requirement level. When all test cases related to a business requirement have passed, the business requirement is "done" and fit for the market.
Information about costs
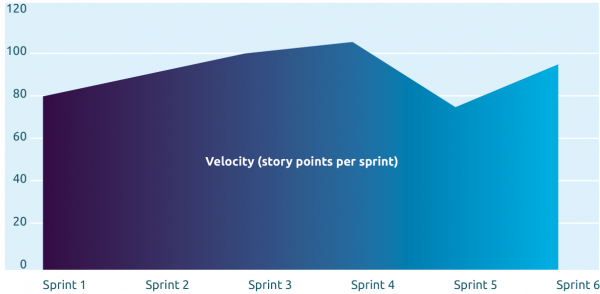
In DevOps, the costs of testing are usually not separately calculated and measured. Instead, the overall velocity of the team is a cost indicator. The velocity is the amount of work the team can do in a given period of time. Often, the work is measured in story points and the time is a sprint of two weeks. If the team cannot meet its average velocity in a specific sprint, this is a clue that there may be a problem with either the quality of the product (e.g. many anomalies) or with the quality of the process (e.g. problems with the pipeline-tooling).
Information about anomalies
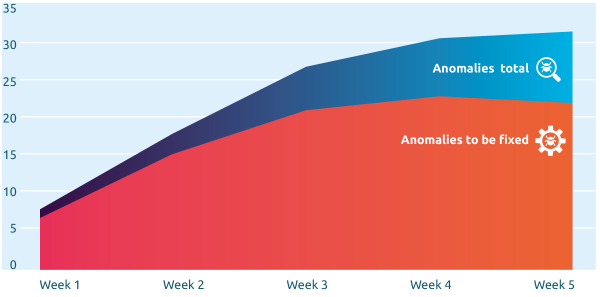
There is often a lot of emphasis in IT projects on information regarding the anomalies found and their severity. The number of anomalies doesn’t mean much. If there are many anomalies, does that make the product bad? If there are few anomalies, maybe there was just too little time to test.
Basically, the only relevant information about anomalies is the trend in fixing of anomalies. When the number of anomalies "not fixed" is not decreasing this is an indicator of a quality problem, although it does not give specific information about the quality and risk of the test object.
Overall information: the confidence monitor
Based on all the different types of information, the stakeholders will establish their confidence level, indicating whether the new or changed IT system will support the business process in such a way that the pursued business value will be achievable. Therefore, to be complete, it should be called the "confidence in achieving the pursued value monitor".
This confidence level can be shown in a graph where the planned confidence level shows how the IT delivery process was expected to evolve, and the actual confidence level shows the current and past measurements.
Examples of information that is used to add up to one confidence rating are: measure of available functionality, measure of successfully tested functions, measure of stability of the live environment, survey of the confidence feeling of users, measure of view-to-sales conversion rates and customer retention rates, et cetera.
In such a confidence monitor there needs to be a specific confidence level that is good enough to start using the product. In the example below, with a 0 to 9 scale, that would be confidence level 6 - satisfactory.
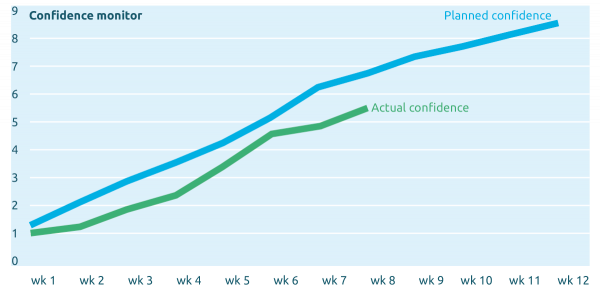
The confidence monitor reporting is not just suited on the overview-reporting level; it can also be added to the high-level reporting that is described in the next section.
High-level reporting
For high-level management, the reporting can be quite simple. This type of stakeholder doesn't need details, they just need an impression of the situation.
Therefore, an overview with a few smileys, such as the example below, works well. Seeing a red smiley will probably trigger them to ask for more information, which is easily available in the other levels of reporting.

If you would like to supply some additional information, the confidence monitor is a good graph to use. Also, information based on the status and coverage of the business requirements is appreciated by high-level business managers.
How is the information communicated and how do alerts work?
In DevOps, teams will strive for an automated generation of all information in such a way that the stakeholders can get all information they need at any moment. This requires, however, that all relevant data is stored in a standardized way. When the entire pipeline is automated, and all activities performed by tools, this should not be a problem. In most situations some manual activities will also be performed. Therefore, the people that perform these manual activities need to be able to store their data about results and progress in exactly the same way as the automated processes, so that there is just one source of data to derive the reports from and to supply up-to-date information.
The ultimate information is presented as a live monitor that shows the exact status of product and process. This could be as simple as a lamp that colors green or red, or as sophisticated as a widescreen monitor that shows a dashboard with various graphs in real-time.
Such a live monitor is also an ideal tool for alerting people instantly. To quickly get attention, the alerts should probably also be sent by email to specific people, and maybe these people should receive text messages as well. A modern test management system or quality monitoring system can send these types of alerts.